
<aside> 📘
Series:
For multi-tenant mixed-workload systems like CockroachDB, performance predictability and isolation are critical. Most forms of shared infrastructure approximate these properties, be it through physical isolation within data centers, virtualized resource limits, drastic over-provisioning, and more. For CockroachDB it’s not just about protecting latencies across workload/tenant boundaries, it’s also about isolation from the system’s internal/elastic work like LSM compactions, MVCC garbage collection, and backups, and also from user-initiated bulk work like changefeed backfills.
For ill-considered reasons this is something they let me work on. Here we’ll describe generally applicable techniques we applied under the umbrella of admission control, how we arrived at them, and why they were effective. We’ll use control theory, study CPU scheduler latencies, build forms of cooperative scheduling, and patch the Go runtime. We hope for it to be relevant to most systems builders (and aspiring ones!), even if the problems motivating the work were found in this oddly-named database.
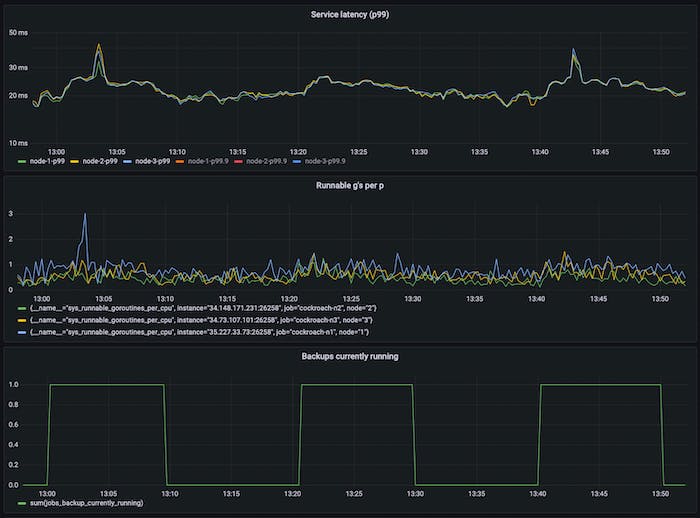
Backups in CockroachDB are scan dominant and therefore CPU-heavy; it operates over some specified keyspace, exporting the data as SSTs (helping speed up imports). It’s well understood that high CPU utilization can negatively affect tail latencies (for reasons this author didn’t previously get, and tried to below), to reduce impact of elastic work on latency-sensitive foreground work, we used statically configured rate limits per-node. This works ok-ish but default values were hard to pick given their dependence on provisioned capacity and observed load (dynamic over time). It’s easy to defeat such rate limiters in practice – below for example we see an unacceptable latency hit due to backups.
3-node 8vCPU cluster running TPC-C with 1000 warehouses and an aggressive backup schedule (incremental backups every 10m, full backups every 1h at the 45m mark), with the p99 latency impact shown.
This problem is more general: any background operation that’s CPU-heavy (LSM compactions, MVCC GC, catchup scans) can adversely impact tail latencies.
After ruling out a few possible causes for latency impact unrelated to utilization (excess block cache misses for example, in case it wasn’t as scan resistant as imagined, or latch contention, or head-of-line blocking in RPC streams), we wanted to understand what exactly it was about high CPU use that resulted in tail latency impact – all we had thus far was unhelpful correlation.
With CPU sometimes high utilization is moderate over-utilization, but was this something we could observe directly? We already knew that lowering backup rate limits helped reduce foreground latency impact, but it wasn’t clear what signal we could use to do this automatically. Using foreground tail latencies in any control loop is untenable since it’s so workload dependent (contention, query sizes). Another problem was that adjusting the rate limiter in its current form was going be too coarse – we could see latency impact with just three backup requests running concurrently, so adjusting it up or down automatically could oscillate between periods of over-{utilization,admission} with latency impact, followed by under-{utilization,admission} with slower-than-necessary elastic work. To be work-conserving, we would need something more granular.
We first looked at a 1000hz sample of the average number of runnable goroutines (think ‘threads waiting to get scheduled’) per processor, hoping to find a large queue buildup. This high-frequency measure was being used already to detect signs of severe overload within admission control, at which point we shift queueing out of the scheduler into DB-managed queues where we can differentiate by priority, like treating internal heartbeat work with the highest priority or GC work with lower priority. Unfortunately, this metric was low-and-varying despite high-but-stable foreground latencies.
Low-and-highly-varying runnable goroutines per-processor despite high-but-stable foreground latencies.
Stumped by metrics and what we thought was a sensitive measure of scheduling latency, we shifted attention elsewhere. We turned to distributed traces, typically helpful with latency investigations. In these experiments we wanted to observe where latency was spent for long tail executions (think p99.9, p99.99) since lower percentiles were mostly unharmed.
Tracing has measurable overhead, especially for a high-throughput system such as ours. With traced executions we’re transferring additional bytes back and forth across RPC boundaries (even just trace metadata can be proportional in byte size to foreground requests/responses), not to mention the additional memory overhead from collecting trace data/logging itself. Tail-based sampling techniques are applicable but unhelpful, often concerned with the overhead of storing the trace data instead of the overhead of tracing itself. Earlier attempts within CockroachDB to get to “always-on tracing” fell flat due to this overhead, despite attempts to re-use tracing spans, limiting child spans, only lazily transferring trace data over the network, etc. Enabling tracing for all executions to capture a p99.99 trace can perturb the system under observation, through sheer stress, enough to no longer capture the trace of interest. It’s self-defeating in the funniest way.

Latency and throughput impact of always-on tracing. On the left we’re always tracing, on the right we aren’t. Yikes.